Article

Three Gorges Dam Operation Altered Networks of Social–Economic–Ecological System in the Yangtze River Basin, China

1
State key Laboratory of Simulation and Regulation of Water Cycle in River Basin, China Institute of Water Resources and Hydropower Research, Beijing 100038, China
2
Department of Water Ecology and Environment, China Institute of Water Resources and Hydropower Research, Beijing 100038, China
3
Ecological Environment Engineering Research Center of the Yangtze River, China Three Gorges Corporation, Beijing 100038, China
4
Institute of Earth Sciences, China University of Geosciences, Beijing 100038, China
*
Authors to whom correspondence should be addressed.
Sustainability 2023, 15(5), 4465; https://doi.org/10.3390/su15054465
Submission received: 31 December 2022 / Revised: 5 February 2023 / Accepted: 28 February 2023 / Published: 2 March 2023

Abstract

:
It is necessary to review changes in the interactions of indicators following the construction of the Three Gorges Dam (TGD) in order to explore the impact of the dam on ecology. Research on changes in interactions among indicators of the comprehensive social–economic–ecology system in the Yangtze River Basin is limited, and the objective of this study was to investigate how this system changed after the operation of the TGD, as well as how the indicators contributed to this change. Here, the correlational network approach using 38 data point indicators from 1949 to 2018 of the Yangtze River Basin was applied to analyze the changes in indicator interactions before and after the TGD operation. The TGD impoundment altered networks of the social–economic–ecological system in the Yangtze River Basin. Indicators are both less positively and less negatively connected. The number of synergy and trade-off networks clusters changed from two (Modularity = 0.33) to -six (Modularity = 0.23) and from two (Modularity = 0.015) to four (Modularity = 0.34) after the TGD operation, indicating that the sustainable development of the Yangtze River Basin might be at a middle level after the TGD operation. Further analysis revealed that the mean annual discharge, downstream fry runoff, and downstream counts of the eggs and larvae of four carp, diatom abundance index, breeding population of Chinese sturgeon, and annual precipitation contributed more to the changes in the networks after 2003.

1. Introduction

Quantifying the interactions among indicators systematically is challenging [1]. As the third longest river and water-rich river system in the world, the Yangtze River, as shown in Figure 1, has been disturbed by human activities over the past 70 years. It covers one-fifth of the land of the People’s Republic of China and flows through mountains, plateaus, basins, hills, and plains [2,3]. The range of the DEM value of the Yangtze Basin is from −70 to 6444 m (Figure 1). As China developed, it became one of the most human-impacted rivers worldwide [4]. To promote the development of the “Yangtze River Economic Belt”, there is a new development plan [5]. Humans have greatly benefited from dam construction, including enhanced water supply, flood control, crop irrigation, and electricity generation [6]. However, negative effects on the ecological environment have also been observed, including river flow modification, water quality decline, and habitat fragmentation [6]. As the largest power station in the world, the Three Gorges Dam (TGD) began trial operation in 2003 and was fully operational in 2009 [7]. The Three Gorges Reservoir Region (TGRR), with a distance of approximately 600 km, is between Chongqing and Yichang on the Yangtze River [6]. Extensive attention has been paid to detrimental impacts on the environment. There are some uncertainties, opinions, and disagreements regarding the costs and benefits of this project [8]. Damming, water pollution, disconnecting lakes from rivers, overfishing, channel construction, and vessel navigation could all affect Yangtze River organisms and their habitats [9,10,11,12].
The Three Gorges Dam operation times for 2003 were selected as time-series analysis cutoff points for the following reasons. The capacity of the TGD is 3.93 billion m3, which is much greater than dams previously built in the Yangtze River Basin, and this therefore plays a predominant role in the reaches [13]. An unprecedented negative impact was caused by the construction, and the riverine ecosystem is at significant risk [13]. The hydrological regime along the Yangtze River has significantly altered after the impoundment of the TGD [13]. Annual sediment and dissolved silicate (DSi) load decreased considerably when compared to the pre-operation period of the TGD [14]. Water level alterations downstream of the Yangtze River have been reported [15]. Dam construction contributes to the loss of spawning areas and the consequent decline in affected species. Changes in the habitat of some aquatic species in the river ecosystem after the TGD have also been reported [16]. The last reason is that dams have given rise to unsustainability trends in social economics. For example, continued economic growth, population size, and living standards are accompanied by an increase in industrial waste, pesticides, and untreated sewage being discharged into the Yangtze River Basin [10]. Clear views and well-organized information related to these impacts have not been accessed by the public.
Indicators were selected to highlight the differences between the ideal and existing states of a system, using an integrated value for a specific purpose [17]. An inherent uncertainty assessment requires enormous complexity in the ecosystem as a prerequisite. The correlation between physical and abiotic elements could describe ecological integrity to some extent, but biological elements are also required when applied to ecology. The integrity of biology and structure in ecosystems can be represented by an ecosystem integrity assessment [18]. Historical or less-impacted status could be employed to compare with the present ecosystem status by using an ecosystem integrity assessment, and the composition of species, as well as the physical and chemical attributes of aquatic ecosystems, could indicate ecosystem integrity in aquatic environments [19]. Hydrological connectivity, fluxes of nutrients and organic matter, habitat connectivity for fish, and community structure of fishes are elements for ecological integrity assessment [20].
There is no untouched, virgin system, or piece of nature left anywhere in the world. Everything is influenced by and interconnected to humans, which is why social–ecological systems have received more attention than either environmental or social systems themselves. The complex network method is a powerful tool for research on the interactions between human and ecological systems in river basins. Network theory could provide the latest integrated way to research the complex interactions of socioeconomic and ecological systems for sustainable human development [21]. Alternative management and the changing future conditions of these systems are complicated because of the complex interrelationships between components. It is detrimental to the system if the understanding of the mechanistic framework of a complex system is wrong. A network is a promising approach for examining socioeconomic and ecological system changes. It is a comprehensive view of a system in which network theory can identify the key indicators that must be monitored to prevent a critical shift in a system [22]. Interconnections between variables can be visualized and conceptualized using network analysis [23]. In addition, well-developed concepts in network theory, such as modularity, connectivity, and neighbor shift (NESH), could be applied in this analysis. In correlational networks, nodes that have higher connection relationships with each other than other nodes are identified into one cluster using the community detection method. Another advantage of network analysis is that it can more effectively achieve a specific target with limited resources if the target nodes can be identified in networks [23].
Studies on the interactions between multiple systems in the Yangtze River can be classified into three categories: carrying capacity theory, Environmental Kuznets Curve (EKC) theory, and coupling coordinated development theory [24]. However, most of the above studies focused on coupling coordination among multiple systems in a region. Complex system interactions using system thinking and analysis are at the forefront of sustainable development research [25]. Health, ecosystems, societies, and Sustainable Development Goals (SDGs) are popular research topics [22,25,26,27]. System-thinking-related network theory on socioeconomic and ecological integrity indicators has not yet been applied in the Yangtze Basin. A framework of human–water multiple networks to analyze the combined effects of human and water interaction relationships in the Yangtze River Basin identified the impacts of economic activities on water resources and the environment [28]. However, indicators related to ecology, such as fish populations in the Yangtze River Basin, were not included in this study. Therefore, network theory studies to quantify the interactions between socioeconomic and ecological integrity are necessary.
The objective of this study was to explore the changes in interactions among the indicators in the Yangtze Basin that reflect ecological systems and socioeconomic conditions. In this paper, the authors (1) focused on the interactions among the Yangtze River socioeconomic and ecological environment indicators, (2) investigated the change in the coupling relationship between the indicators, (3) researched the indicators of drivers of the changes in networks before and after TGD operation, and (4) analyzed the regime shift times of detected driver indicators.

2. Materials and Methods

As shown in the abstract graph, the first step is indicator selection, which is based on the sustainable ecosystem integrity definition, which is composed of ecological integrity indicators and human activity indicators. After that, time-series indicators data are required to be rescaled to standardized variables, which were between 0 and 1 using Formula (1). When time-series data were rescaled, interactions among indicators were calculated by Spearman correlation coefficients. Next, the ‘cluster walktrap’ algorithm was applied to find densely connected subgraphs. Attributes in the networks, such as connectivity, modularity, and neighbor shift (NESH), were employed to identify the contributor indicators of network alteration before and after the TGD operation. Finally, sequential t-test analysis of the regime shift (STARS) detection method was used to analyze whether the identified contributor indicators have regime shift.

2.1. Indicator Selection

Fishes, phytoplankton, macrophytes, and macroinvertebrates are the basis for the biological integrity of aquatic ecological integrity. Aquatic habitat, such as water quality and sediment, is a hydromorphological parameter for ecological integrity assessment [27]. An intact reference condition of the ecosystem that is unaffected or minimally disturbed by human activities could suggest that the degree of ecological integrity is high [29]. Sustainable ecosystem integrity introduces a human dimension to the ecological integrity assessment, as human activities in the river ecosystem are partially reversible or irreversible [29,30,31]. Applying the sustainable ecosystem integrity assessment approach (as shown in Table 1), ecological integrity, and related socioeconomic indicators, 38 indicators were selected for the analysis [1]. Information on these indicators is presented in Table 1 and Table 2. There are two kinds of indicator codes, which are represented as X and Y (Table 1 and Table 2). Indicator Code Y represents biological variables, such as fish or diatom-related indicators. Meanwhile, Indicator Code X represents variables that could give rise to changes in biological variables, for instance, socioeconomic, physical, or chemical factors.

2.2. Data Preparation

All indicator variables were rescaled to standardized variables, which were between 0 and 1, using the following formula:
StV = ( x     x min ) / ( x max   x min )
where StV is the standardized variable, x is the target variable, xmin is the minimum value of the time-series data of the target variable in Table 2, and xmax is the maximum value of the time-series data across all plots of the target variable in Table 2 [22].

2.3. Interactions among Indicators

Correlation analysis could be measured to express the association or relationships between two or more quantitative variables [35]. The value of the correlation coefficient ranges from −1 to 1, in which −1 means the two variables are perfectly linearly related in a negative manner, 0 means the two variables have no linear relationship, and +1 means the two variables are perfectly linearly related in a positive manner [35]. The greater the absolute value, the stronger the association. Pearson correlation coefficients were used to represent the interactions among Sustainable Development Goals (SDGs) [25]. Moreover, Spearman correlation coefficients were applied to calculate the relationships among the biodiversity, ecosystem function, and ecosystem for forest and grassland variables [22]. A normal distribution test was applied to 38 indicators by Statistical Product and Service Solutions (SPSS) software, as it is a prerequisite to using Pearson correlation analysis that two variables conform to a bivariate normal distribution. However, the results show that not all the indicators conform to a normal distribution. Therefore, Spearman correlation coefficients were calculated by SPSS to indicate the interaction strength between the two indicators [22]. Synergy and trade-off are represented by positive and negative values [25,36]. The strength of the interaction is represented by the absolute value of the Spearman correlation coefficients. Each indicator was divided into two time-period groups, being 1949–2003 and 2004–2018.

2.4. Network Analyses

The network graphs were analyzed using the R package igraph in R studio software [37]. Thirty-eight interactive indicators and the interactions among them were reflected by the nodes and links on the network graph. In the network, each node represented an individual indicator, and pairwise indicators that were significantly (p < 0.05) correlated were connected by a link, where the strength of each link indicates the Spearman correlation coefficient. In addition, the ‘cluster walktrap’ algorithm in igraph was applied for modularity calculations in synergies and trade-off network graphs [38]. The ‘cluster walktrap’ is an algorithm employing random walks for community detection [39]. This method could identify which indicators were more related to others, and which groups of indicators could be achieved together. The number of communities in a network graph calculated is not set before applying the walktrap method [39]. In the network analyses process, only significant correlation coefficients (p < 0.05) were used for calculation. Networks were also formed by selecting correlations with an absolute coefficient greater than 0.3 and correlations with an absolute coefficient greater than 0.5 in each time-period group for comparison [40].
The connectivity of every indicator in the interaction networks can be expressed by the weighted node degree, which is the average absolute value of the correlation coefficients for all the connected nodes of the node, as illustrated in Table 3 [41]. This method was applied to identify the most connected node and study the variation in the connectivity of each node [22].
The NetShift methodology that could identify the driver nodes between case–control association networks was used to determine driver indicators from the 1949–2003 to 2004–2018 period networks (https://web.rniapps.net/netshift/ (accessed on 1 May 2021)) [42]. Case networks: 2004–2018 positive or negative Spearman coefficient relationship networks. Control networks were the 1949–2003 positive or negative Spearman coefficient relationship networks. In this method, the neighbor shift (NESH) index was used to assess the change in the associations of a node. It was developed to calculate the alteration of an individual node in the networks directionally [42]. If the value of NESH of a node of the case group is higher than the value of NESH of this node of the control group, this node would be represented by red [43]. In addition, nodes that are bigger are particularly important ‘drivers’.
Table 3. Network metrics used in this study.
Network MetricDefinitionMeaning in the Indicators Network
ConnectivityProportion of positive or negative links to all possible links in the network, weighted by the strength of the links [25].More indicators can be achieved simultaneously if the synergy networks have a higher connectivity value. More indicators cannot be achieved simultaneously if the trade-off networks have a higher connectivity value.
ModularityA module represents a group of nodes that are highly inter-connected, and loosely connected to others. Modularity represents the strength of the partition of a network into modules [25].In a highly modular network, indicators can be divided into groups based on their connections, while in a less modular network, the interactions of all indicators are closer. When edges are randomly formed, the modularity value is close to zero. If the modularity score is higher than 0.3, the network structure could be regarded as significant [44].
NESHChanges in networks of a single node [42]In a higher NESH value, the nodes contribute more to the entire network changes. This node may be regarded as the driver node of the alteration.

2.5. Regime Shift Detection

The shift times of driver indicators that were selected by connectivity and NESH were tested using Sequential Regime Shift Detection Software Ver3.2 [45]. Sequential Regime Shift Detection Software Ver3.2 is a significant shift software written in Visual Basic for Application (VBA) for the Excel 2002 environment [46]. This software is based on the sequential t-test analysis of regime shifts (STARS). It is available at the Bering Climate website (www.beringclimate.noaa.gov (accessed on 1 March 2021)). The process of how to use it is available on the website. Shift time detection application of these selected indicators could for further analysis of the alteration of networks before and after the TGD.

3. Results

The connectivity of both synergy and trade-off networks show decreasing trends after 2003 (Figure 2 and Figure 3). The trends of 38 indicator relationships pointed to a process of decoupling and recoupling of indicators during the trial operation of the Three Gorges Dam (TGD) in 2003 (Figure 4). This suggests that the 38 indicators were divided into isolated groups after 2003. The changes in modularity values are the opposite between synergy and trade-off networks. The modularity value of synergy networks declined from 0.33 to 0.23, while the modularity value of trade-off networks increased from 0.015 to 0.34 after the trial operation.

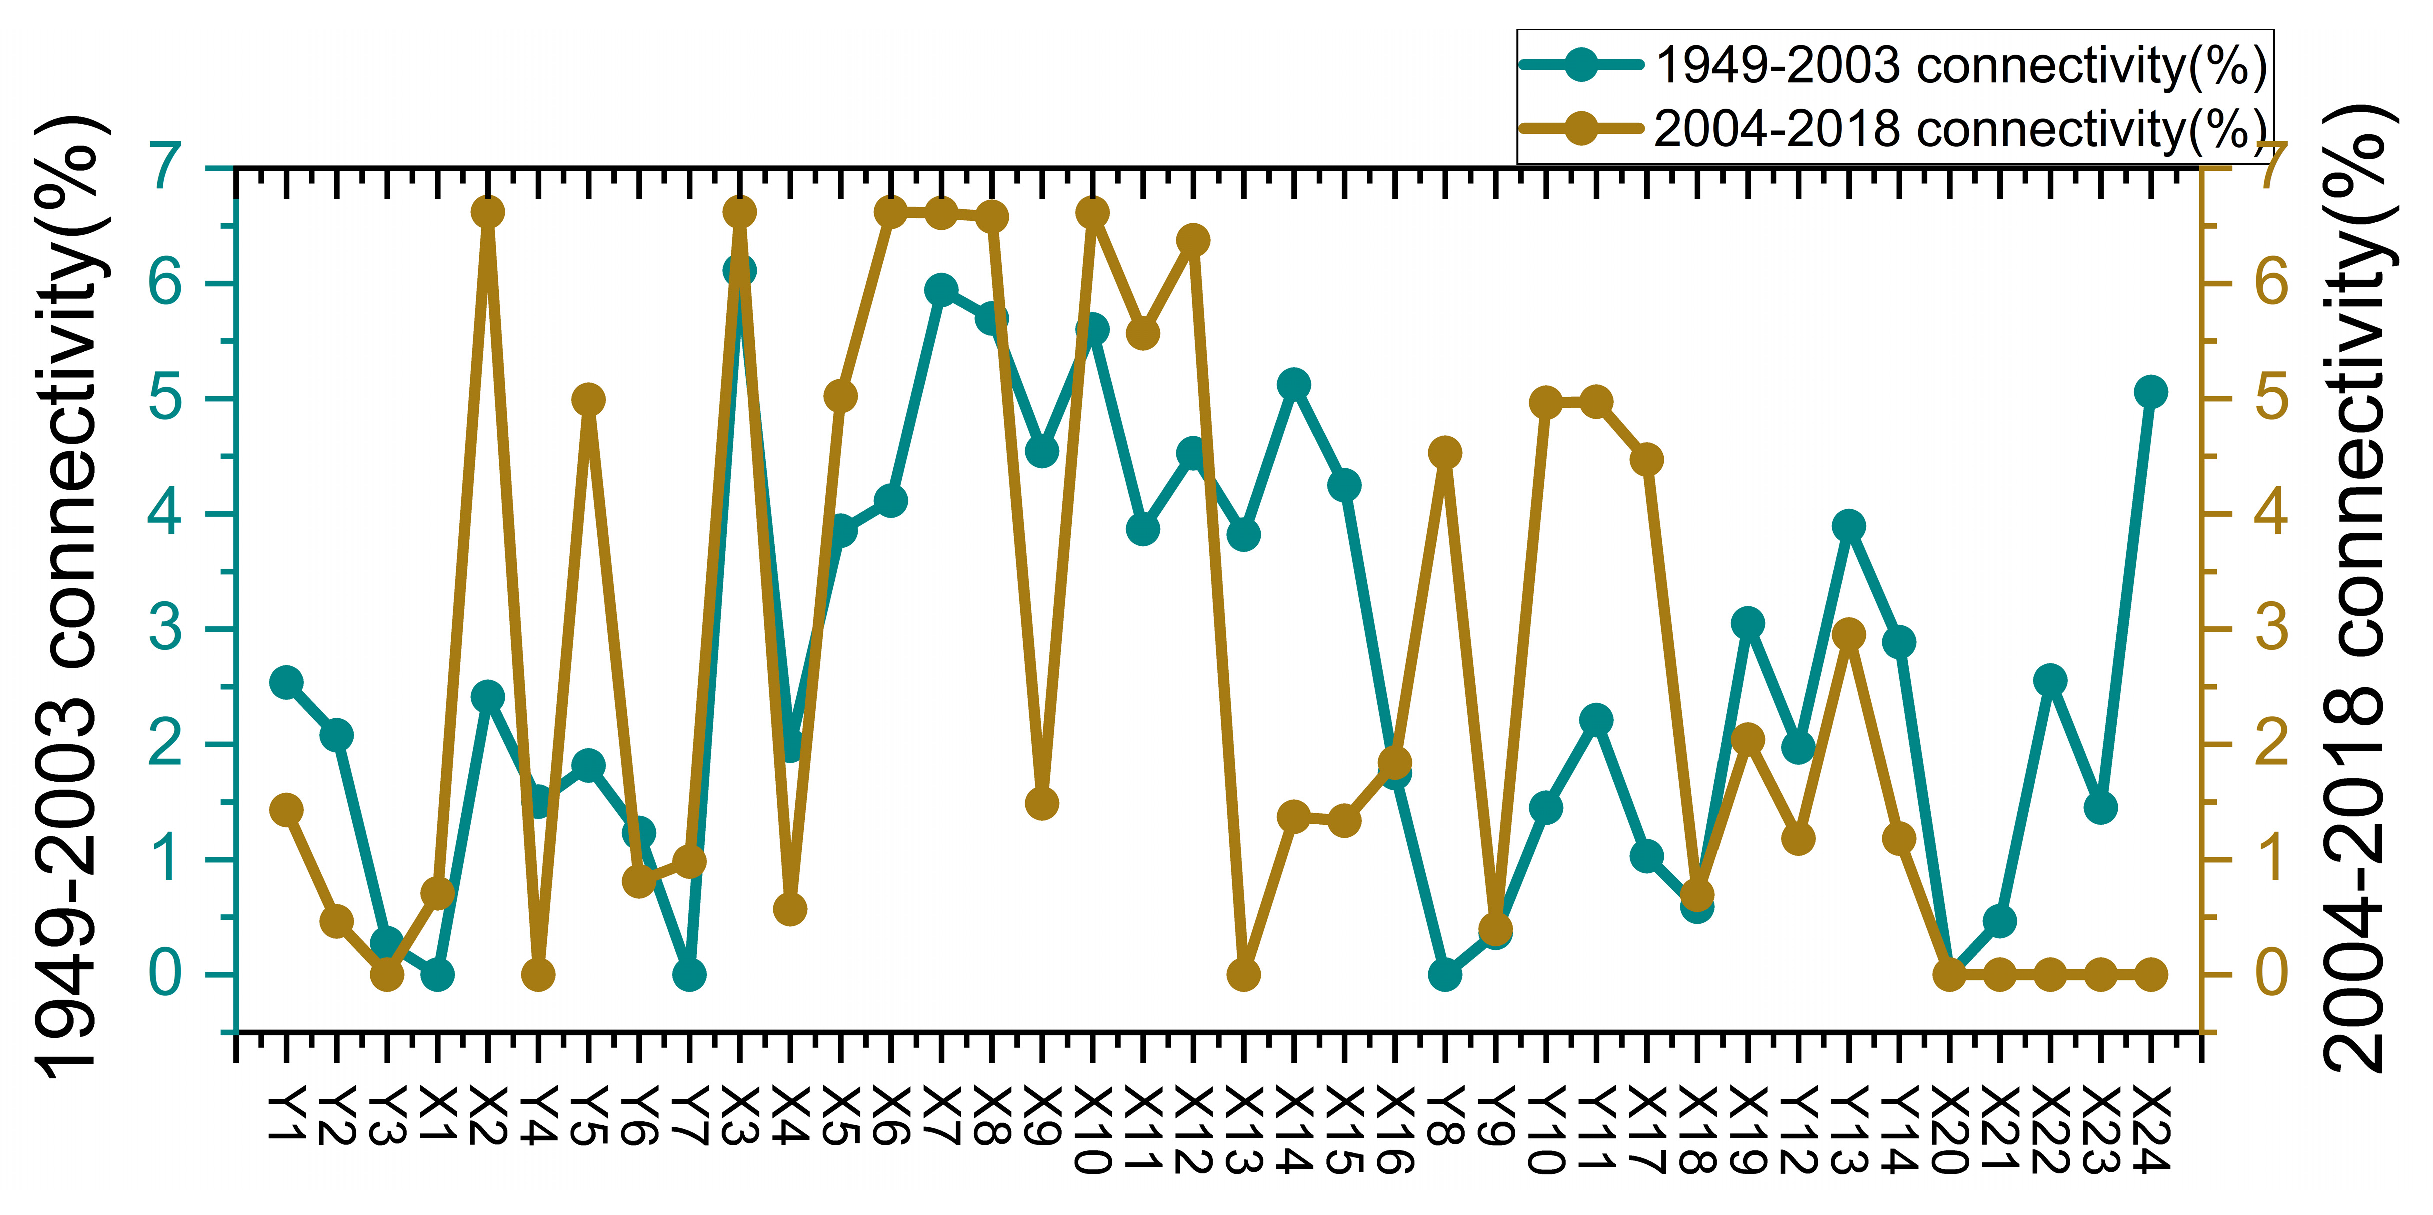
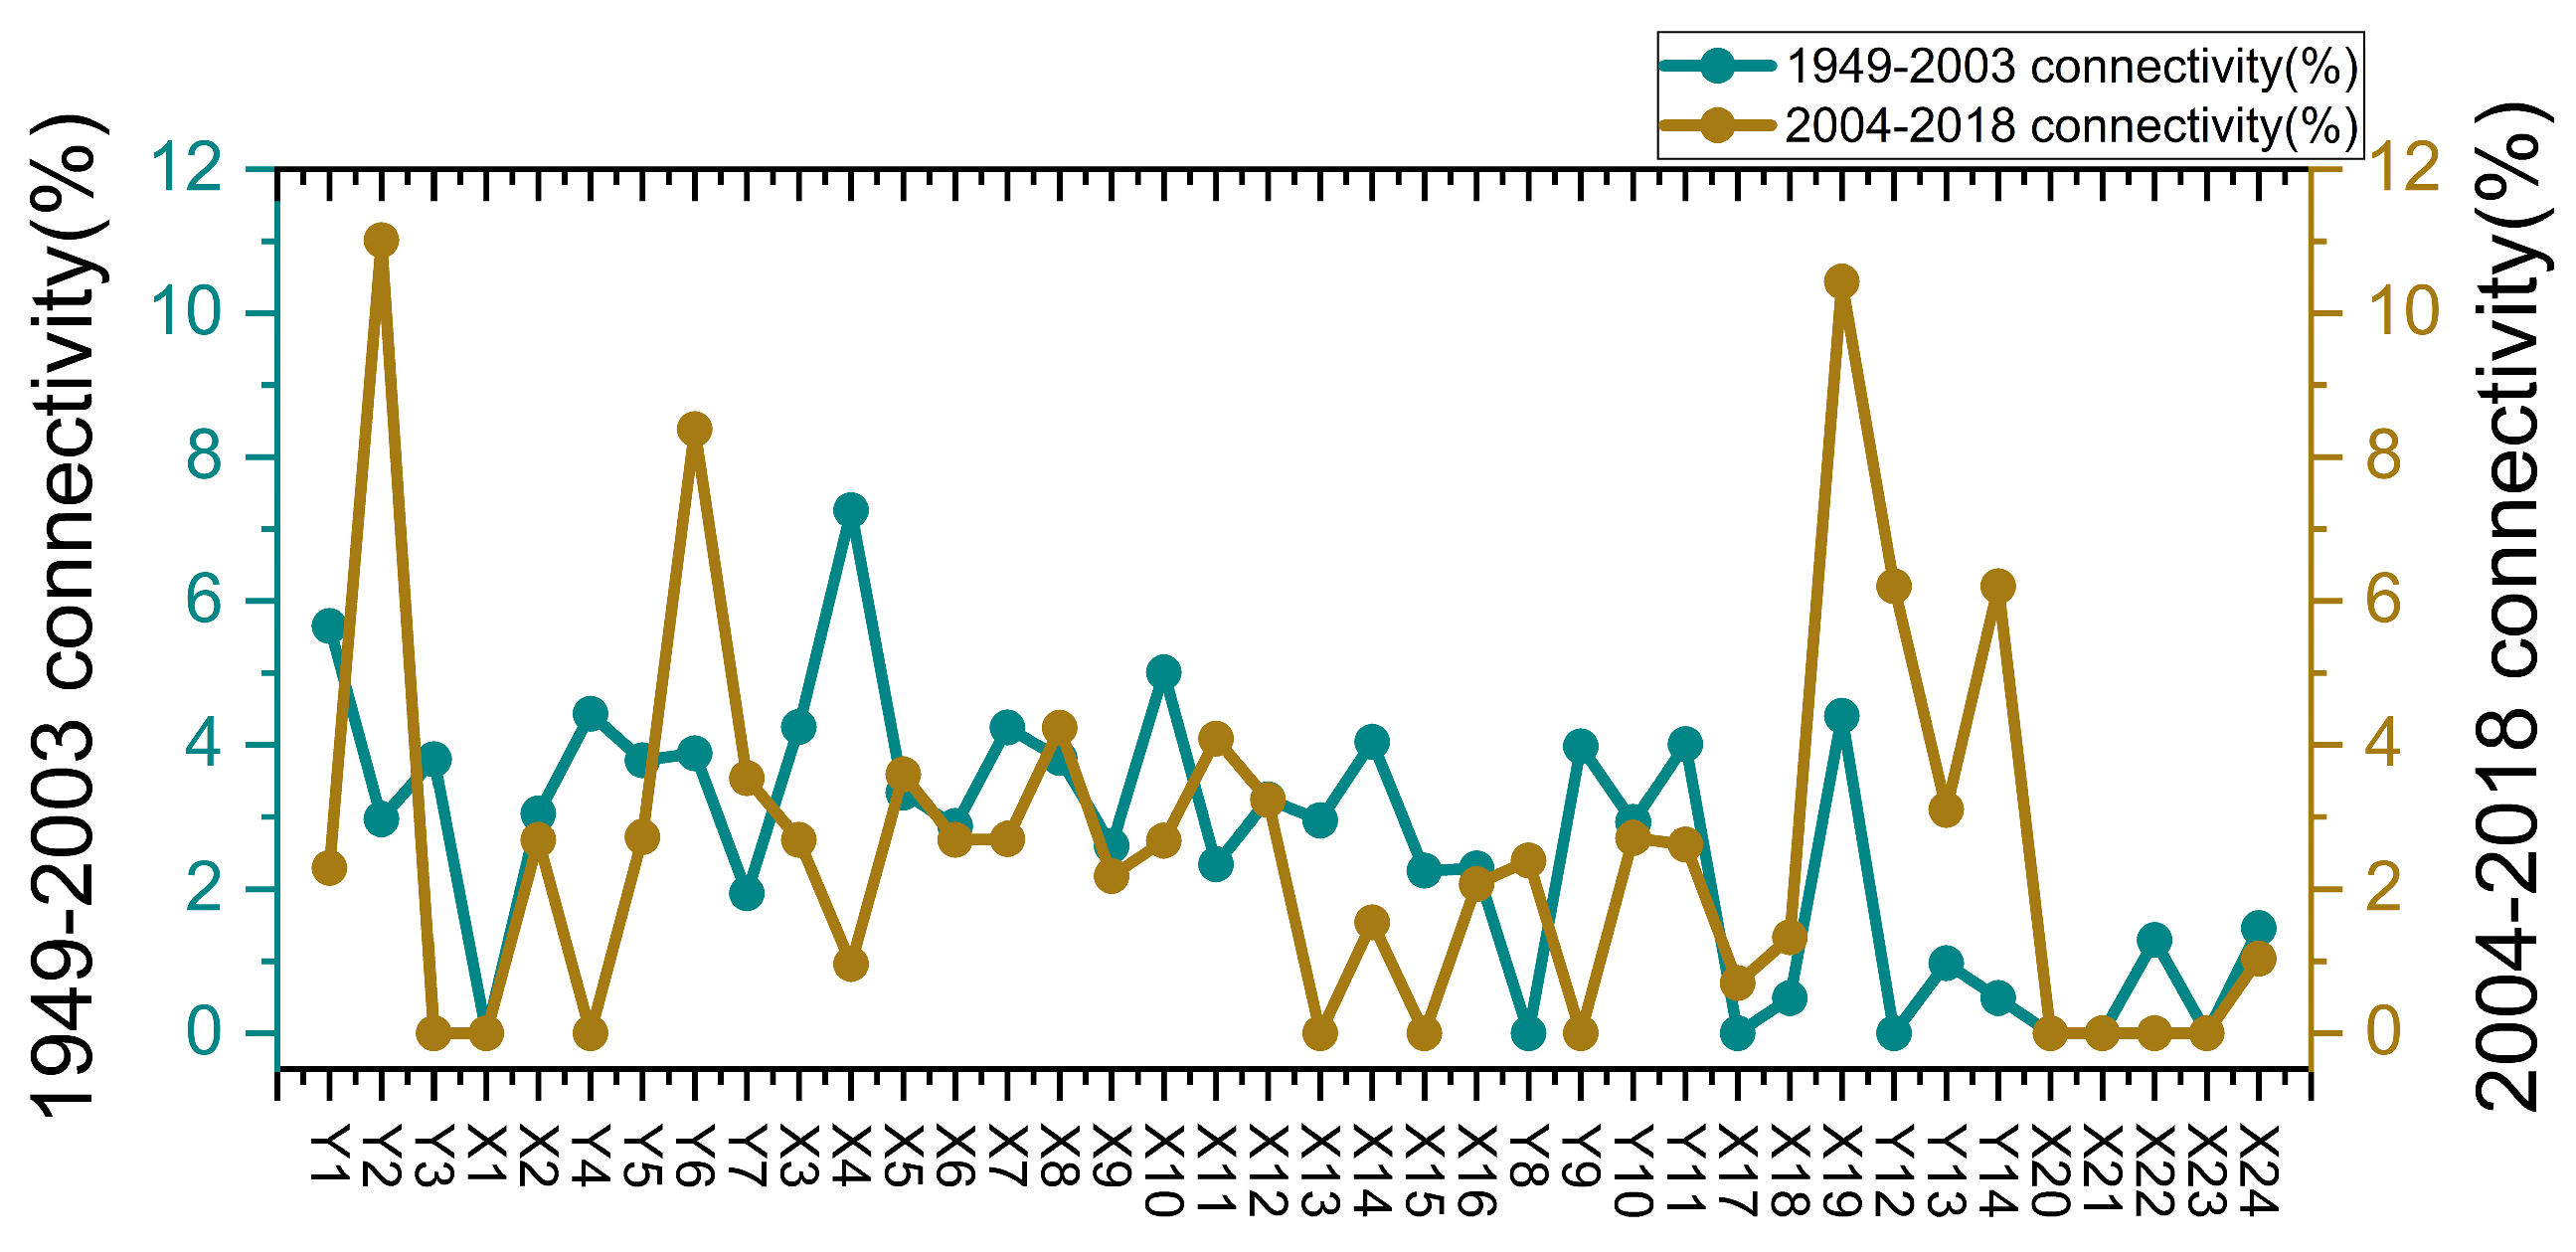
3.1. Highly Connected Indicators

In the synergy networks, the highest value of connectivity of indicators (Figure 2) varied from cumulative reservoir storage capacity upstream of TGD (X3) to total cargo volume in the Yangtze River Basin (X2) after the operation of the TGD. In the 1949–2003 period, the relatively dominant indicators were the cumulative reservoir storage capacity upstream of TGD (X3), the GDP of the Yangtze River Economic Belt (X7), and the population of the Yangtze River Economic Belt (X8). However, the comparatively dominant indicators were total cargo volume in the Yangtze River Basin (X2), cumulative reservoir storage capacity upstream of TGD (X3), and sewage treatment rate (X6) during the period 2004–2018. The cumulative reservoir storage capacity upstream of TGD (X3) was the correspondingly prominent node of the Yangtze River Basin from 1949 to 2018, which means that dam construction affected the ecosystem integrity and socioeconomic conditions of the Yangtze River Basin. In addition, these highly connected indicators were clustered into the same modules both before and after the dam operation.
The relatively larger changes in connectivity in the synergy network were the cumulated area of the isolated lake (X24) and the average number of upstream fish species (Y8), which changed from 5% to 0 in the networks and changed from 0 to 4.5%, respectively. The cumulative area of the isolated lake had significant positive relationships with social, economic, and diatom indicators before the 2003 group. The cumulative area of the isolated lake (X24) had a positive relationship with domestic sewage in the Yangtze River Economic Belt (X5), and the relationship became negative after the operation.
In the trade-off networks (Figure 3), the degree of connectivity was relatively low compared to the synergy networks. The most connected node moved from industrial wastewater in the Yangtze River Economic Belt (X4) to the number of breeding populations of Chinese sturgeon (Y2) after the operation trial of the TGD. Annual catch of fish (Y1), industrial wastewater (X4), and application amount of compound fertilizer (X10) were comparatively primary nodes in the group of 1949–2003. In contrast, the number of breeding populations of Chinese sturgeon (Y2), sediment concentration (X19), and total catch of bronze gudgeon below Gezhouba Dam in the mainstem Yangtze River (Y6) were the top three indicators in the group of 2004–2018. This shows that in the trade-off networks, biological indicators played an important role in negative interactions. Except for Y1, all of these highly connected indicators clustered into the same modules in both time-period groups. The number of breeding populations of Chinese sturgeon (Y2), sediment concentration (X19), absolute diatom abundance (Y12), and industrial wastewater (X4) were the indicators that were calculated to have comparatively higher connectivity variation values in the trade-off network alteration. The breeding population of Chinese sturgeon (Y2) had a trade-off relationship with nitrogen application amount (X9), application amount of compound fertilizer (X10), planting area (X11), forest area (X12), grassland area (X13), application amount of phosphate fertilizer (X14), LTN (X15), and oxygen consumption (X22) during the 1949–2003 period. The negative network edges of Y2 changed to annual catch of fish (Y1), total cargo volume in the Yangtze River Basin (X2), cumulative reservoir storage capacity upstream of TGD (X3), domestic sewage (X5), sewage treatment rate (X6), GDP (X7), population (X8), application amount of compound fertilizer (X10), planting area (X11), forest area (X12), upstream fish species (Y8), mean annual discharge (X17), and annual precipitation (X18) nodes from 2004 to 2018. It indicates that the breeding population of Chinese sturgeon became more negatively connected with socioeconomic and land-use indicators after the TGD operation. In addition, it had a competitive relationship with fishery resources during this period.

3.2. Disruption of Indicator Modules

The alterations in the module composition of indicators of synergy and trade-off networks (Figure 4) imply the decoupling and recoupling process of indicators because the networks clustered into more modules and were less connected after the operation of the Three Gorges Dam. In the positive interactions, 34 indicators were clustered into two groups with a modularity value of 0.33 during the period of 1949–2003, while 30 indicators were gathered into six groups in the period of 2004–2018 with a modularity value of 0.23.
In the positive interaction group, the four indicators that were not connected with the other 34 indicators from 1949 to 2003 were sand mined in the mainstream of the middle and lower Yangtze River (X1), total catch of yellow catfish below Gezhouba Dam in the mainstream Yangtze River (Y7), upstream fish species (Y8), and water temperature (X20). In contrast, in the 2004–2018 period, eight nodes namely hilsa fishing yield (Y3), total estimated number of adult Chinese paddlefish below the Gezhouba Dam in the mainstream of the Yangtze River (Y4), grassland area (X13), water temperature (X20), total ion (X21), oxygen consumption (X22), ion flow rate (X23), and cumulated area of the isolated lake (X24) were not connected with other nodes. Only water temperature (X20) did not connect with the other indicators from 1949 to 2018.
The trend of negative interactions was similar to that of positive interactions. Thirty-one indicators were classified into two clusters with a modularity value of 0.015 before the dam operation. The period of 2004–2018 negative interactions of 28 indicators was divided into four modules (modularity value = 0.34). These modules were disrupted, and the number of modules increased as the modules became smaller and reunited.
Four nodes, which were sand mined in the mainstream of the middle and lower Yangtze River (X1), water temperature (X20), total ion (X21), and ion flow rate (X23), maintained a trend not related to other nodes in the trade-off networks. Except for the former indicators mentioned, three indicators, namely, upstream fish species (Y8), mean annual discharge (X17), and absolute diatom abundance (Y12), were not connected with other indicators in 1949–2003. Hilsa fishing yield (Y3), total estimated number of adult Chinese paddlefish below the Gezhouba Dam in the mainstream of the Yangtze River (Y4), grassland area (X13), LTN (X15), percentage of upstream endemic fish species (Y9), and oxygen consumption (X22) were indicators that did not have significant correlation relationships with other indicators after the operation commenced.
During 1949–2003, sand mined in the mainstream of the middle and lower Yangtze River (X1), upstream fish species (Y8), and water temperature (X20) were not significantly correlated with other indicators in either the synergy or trade-off networks. Hilsa fishing yield (Y3), total estimated number of adult Chinese paddlefish below the Gezhouba Dam in the mainstream of the Yangtze River (Y4), grassland area (X13), water temperature (X20), total ion (X21), oxygen consumption (X22), and ion flow rate (X23) did not appear in the synergy networks or in the trade-off networks during the period of 2004–2018.
The mean annual discharge (X17), downstream fry runoff (Y11), downstream eggs and larvae of the four carp species (Y10), total number of the four major carp species fry below Gezhouba Dam in the mainstream Yangtze River (Y5), and diatom aroma—Wiener count (Y13) are the indicators that are the nodes in red and relatively bigger (Supplementary Figures S5 and S6). Therefore, these are the driver indicators of the change in synergy networks. The diatom abundance index (Y14), breeding population of Chinese sturgeon (Y2), annual precipitation (X18), and diatom aroma—Wiener count (Y13) are the indicators that are the nodes in red and relatively larger (Supplementary Figure S7). Therefore, these four nodes are the driver indicators of trade-off network change. However, there were no shifts in time at Y14 and Y13. In 2014, the RSI value for X18 was 0.68 (Supplementary Figure S8).

4. Discussion

Understanding the changes in indicator interactions after the operation of the TGD is crucial for developing appropriate and integrative watershed management policies [25]. The 38 indicators experienced a decoupling and recoupling process; indicators were both more positively and negatively connected and clustered into fewer modules before the dam operation. The overall score of the Sustainable Development Goals (SDGs) Index could be regarded as the 17 SDGs achievement percentage, and more detail is on the website of the Sustainable Development Report (https://dashboards.sdgindex.org/map (accessed on 3 October 2022)). It has been illustrated that as the level of sustainable development increases, there is a decoupling and recoupling process of the 17 SDGs interactions [25]. At the lower (SDGs Index score = 54) and higher (SDGs Index score = 78) sustainable development level, SDGs were both more connected in synergy or trade-off networks. However, SDGs clustered into more isolated modules by the walktrap and were less connected at the middle level (SDGs Index score = 66). This observed phenomenon verified the Environmental Kuznets Curve (EKC) hypothesis, which proposes a U-shaped relationship between economic development and environmental degradation [47]. These studies might help to indicate that the development level of the Yangtze River Basin is at a middle level because the networks of the dam operation group are more isolated and less connected. This means it is necessary to ensure sustainable development, and requires a solid protection policy for the Yangtze River. The finding of decoupling of SDGs followed by recoupling as sustainable development progresses might predict that the 38 indicators in the Yangtze River Basin could be more connected and recoupling into fewer modules with improvement in sustainability [25]. In the current research, the selection principle of indicators for ecological integrity assessment is subjective, and node connectivity and NESH in network analysis might be useful for index selection in a more objective manner for ecological integrity assessment.
There are five nodes: cumulative reservoir storage capacity upstream of TGD (X3), domestic sewage (X5), sewage treatment rate (X6), GDP (X7), and application amount of compound fertilizer (X10), whose Spearman correlation coefficient value equaled 1 and p < 0.05 with total cargo volume (X2) from 1949 to 2003. In addition, these six socioeconomic indicators nodes were clustered in the same group in the synergy networks. The positive interactions of these six indicators were similar in the 2004–2018 group. In addition, these six nodes were assigned to the same group in the second quantum. This indicates that the construction of reservoirs contributes to the development of society and the economy, but they can also cause environmental degradation. Moreover, it has been demonstrated that anthropogenic fertilizer application increases with GDP growth in the Yangtze River [48].
The study of modularity could be effective in analyzing closely interacting indicators in one module and the relationships among different groups [49]. In the 1949–2003 synergy networks, two clusters were identified using the walktrap algorithm in R. Cumulative reservoir storage capacity upstream of TGD (X3), domestic sewage (X5), sewage treatment rate (X6), GDP (X7), population (X8), nitrogen application amount (X9), application amount of compound fertilizer (X10), planting area (X11), forest area (X12), grassland area (X13), application amount of phosphate fertilizer (X14), LTN (X15), absolute diatom abundance (Y12), diatom aroma-Wiener count (Y13), diatom abundance index (Y14), oxygen consumption (X22), cumulated area of isolated lake (X24), and total cargo volume in the Yangtze River Basin (X2) were clustered into one module. To some degree, the application of fertilizers could be affected by the planting area. These two factors can have an impact on food production and GDP. Moreover, the other group members are total estimated number of adult Chinese paddlefish below the Gezhouba Dam in the mainstream of the Yangtze River (Y4), total number of the four major carp species fry below Gezhouba Dam in the mainstream Yangtze River (Y5), industrial wastewater (X4), LTP (X16), Downstream eggs and larvae of the four carp species (Y10), downstream Jianli fry runoff (Y11), mean annual discharge (X17), annual precipitation (X18), sediment concentration (X19), total ion (X21), ion flow rate (X23), annual catch of fish (Y1), hilsa fishing yield (Y2), total catch of bronze gudgeon below Gezhouba Dam in the mainstream Yangtze River (Y6), hilsa fishing yield (Y3), and percentage of upstream endemic fish species (Y9).
The 38 indicators were decoupled into six clusters during 2004–2018 in positive networks. Group 1: sediment concentration (X19), absolute diatom abundance (Y12), diatom abundance index (Y14), and breeding population of Chinese sturgeon (Y2). Group 2: total catch of yellow catfish below Gezhouba Dam in the mainstream Yangtze River (Y7) and industrial wastewater (X4). Group 3: percentage of upstream endemic fish species (Y9), total catch of bronze gudgeon below Gezhouba Dam in the mainstream Yangtze River (Y6). Group 4: LTN (X15), LTP (X16), annual catch of fish (Y1), and population (X8). Group 5: sand mined in the mainstream of the middle and lower Yangtze River (X1), nitrogen application amount (X9), and application amount of phosphate fertilizer (X14). Group 6: total cargo volume in the Yangtze River Basin (X2), total number of the four major carp species fry (hundred million) below Gezhouba Dam in the mainstream Yangtze River (Y5), cumulative reservoir storage capacity upstream of TGD (X3), domestic sewage (X5), sewage treatment rate (X6), GDP (X7), application amount of compound fertilizer (X10), total planting area (X11), forest area (X12), upstream fish species (Y8), downstream eggs and larvae of the four carp species (Y10), downstream fry runoff (Y11), mean annual discharge (X17), annual precipitation (X18), and diatom aroma—Wiener count (Y13). It has been demonstrated that the P cycle follows the N cycle, except when there is a route passing the P from rivers to the land biota through the biological uptake process [50]. In the mainstream of the middle and lower Yangtze River (X1), the total catch of yellow catfish below Gezhouba Dam in the mainstream Yangtze River (Y7) and upstream fish species (Y8) are the nodes that were isolated and then coupled into clusters. In contrary, hilsa fishing yield (Y3), total estimated number of adult Chinese paddlefish below the Gezhouba Dam in the mainstream of the Yangtze River (Y4), grassland area (X13), total ion (X21), oxygen consumption (X22), ion flow rate (X23), and cumulated area of isolated lake (X24) are the indicators decoupled into isolated nodes.
The trend in synergy networks with an absolute coefficient greater than 0.3 is the same as the networks that did not select the coefficient value. The trend of synergy networks with an absolute coefficient greater than 0.5 is similar to the two networks mentioned above. All six synergy network clusters were the same.
The mean annual discharge (X17), downstream fry runoff (Y11), downstream eggs and larvae of the four carp species (Y10), total number of the four major carp species fry below Gezhouba Dam in the mainstream Yangtze River (Y5) and diatom aroma—Wiener count (Y13) are the indicators that are the nodes in red and relatively bigger, therefore, these are the driver indicators of the change in synergy networks. However, no shift times were observed at Y13. Moreover, 1969, 2014, 2001, 2003, 2016, 2003, and 2016 are the regime shift times for X17, Y11, Y10 and Y5, respectively. The pre-dam period of the Yangtze River Basin occurred before 1968 [51]. This indicates that the dam operation changed the annual discharge variation in the Yangtze River Basin. The fish resource indicators had a regime shift in 2003, which implies that the Three Gorges Dam operation affected the fish resource indicators, which are contributors to the alteration of the social–economic–ecological system.
In the trade-off networks, total catch of bronze gudgeon below Gezhouba Dam in the mainstream Yangtze River (Y6), cumulative reservoir storage capacity upstream of TGD (X3), industrial wastewater (X4), domestic sewage (X5), sewage treatment rate (X6), GDP (X7), population (X8), nitrogen application amount (X9), application amount of compound fertilizer (X10), planting area (X11), forest area (X12), grassland area (X13), application amount of phosphate fertilizer (X14), LTN (X15), LTP (X16), percentage of upstream endemic fish species (Y9), downstream eggs and larvae of the four carp species (Y10), downstream fry runoff (Y11), sediment concentration (X19), diatom aroma—Wiener count (Y13), diatom abundance index (Y14), oxygen consumption (X22), cumulated area of isolated lake (X24), total cargo volume (X2), annual catch of fish (Y1), hilsa fishing yield (Y3), total estimated number of adult Chinese paddlefish below the Gezhouba Dam in the mainstream of the Yangtze River (Y4), total number of the four major carp species fry below Gezhouba Dam in the mainstream Yangtze River (Y5) and breeding population of Chinese sturgeon (Y2) are in the first module of 1949–2003. The birth rate of fish is affected by ship cargo [50]. The total catch of yellow catfish below the Gezhouba Dam in the mainstream Yangtze River (Y7) and population (X8) are in the second group.
During the 2004–2018 period of negative network period, there were four modules. Group 1: total cargo volume (X2), total catch of bronze gudgeon Coreius heterodon below Gezhouba Dam in the mainstream Yangtze River (Y6), cumulative reservoir storage capacity upstream of TGD (X3), sewage treatment rate (X6), GDP (X7), population (X8), application amount of compound fertilizer (X10), planting area (X11), forest area (X12), upstream fish species (Y8), mean annual discharge (X17), sediment concentration (X19), breeding population of Chinese sturgeon (Y2) and industrial wastewater (X4). The migration distance decreased because of the Gezhouba Dam. As a result, gonadal development was delayed, and the breeding population of Chinese sturgeon declined. In addition, the breeding population declined after the construction of the TGD and Xiluodu Dam [52]. Group 2: domestic sewage (X5), cumulated area of isolated lake (X24), and total catch of yellow catfish below Gezhouba Dam in the mainstream Yangtze River (Y7). Habitat fragmentation and water quality deterioration are the primary causes of fishery resource reduction [53]. Group 3: nitrogen application (X9), application amount of phosphate fertilizer (X14), annual precipitation (X18), and annual catch of fish (Y1). The water quality would decline if the amount of nitrogen application increased [48]. Meanwhile, the habitat of aquatic organisms, especially fish, can be affected. Group 4: total number of the four major carp species fry below Gezhouba Dam in the mainstream Yangtze River (Y5), downstream eggs and larvae of the four carp species (Y10), downstream fry runoff (Y11), absolute diatom abundance (Y12), diatom aroma—Wiener count (Y13), diatom abundance index (Y14) and LTP (X16). In the trade-off networks, upstream fish species (Y8), mean annual discharge (X17), and absolute diatom abundance (Y12) were the nodes isolated in the 1949–2003 group but clustered into modules in the 2004–2018 group. Conversely, hilsa fishing yield (Y3), total estimated number of adult Chinese paddlefish below the Gezhouba Dam in the mainstream of the Yangtze River (Y4), grassland area (X13), LTN (X15), percentage of upstream endemic fish species (Y9), and oxygen consumption (X22) were the nodes that were decoupled into isolated groups after the operation.
The trend of trade-off networks with an absolute coefficient greater than 0.3 is the same as the networks that do not select the coefficient value. The trend of synergy networks with an absolute coefficient greater than 0.5 is similar to the two networks mentioned above. All six trade-off network clusters were the same.
The diatom abundance index (Y14), breeding population of Chinese sturgeon (Y2), annual precipitation (X18), and diatom aroma-Wiener count (Y13) are the indicators that are the nodes in red and relatively larger; therefore, these four nodes are the driver indicators of trade-off network change. However, there were no shifts in time at Y14 and Y13. In 2014, the RSI value for X18 was 0.68. There has been a regime shift in the breeding population of Chinese sturgeons. This is because the Gezhouba Dam blocked the migration of the Chinese sturgeon, and its reproduction was affected by the TGD [54]. Satellite datasets and numerical simulations have demonstrated that the combination of land-use change and the Three Gorges Dam increased precipitation in the Yangtze River Basin [55].
Revealing highly connected indicators can help identify the hurdles and opportunities faced by policymakers when trying to implement successful policies [56]. The results reveal that the indicators of total cargo volume (X2) remained highly positively connected with the indicators of cumulative reservoir storage capacity upstream of the TGD (X3), domestic sewage (X5), sewage treatment rate (X6), and GDP (X7) throughout 1949–2018. At the node level, it has been suggested that the most connected nodes and their relationships, to some extent, can be regarded as targets for more efficient and precise management [21,22]. For instance, in this study, monitoring variations in the cumulative reservoir storage capacity upstream of the TGD (X3), total cargo volume (X2), and sewage treatment rate (X6) would be particularly important in the Yangtze River social–ecological system because these three nodes are the most connected indicators in synergy networks. Moreover, fishery resources, particularly annual catch of fish (Y1) and number of breeding populations of Chinese sturgeon (Y2), industrial wastewater (X4), and sediment concentration (X19), are relatively important in trade-off networks, as these changes in the network may cascade to alter ecosystem functions and services [57,58]. Therefore, these relatively critical indicators can be selected as ecosystem assessment indicators. The disappearance of a module hub (higher connected indicators) might cause the module to fragment [49]. As there are some indicators related to fish, the extinction of a species that is higher connected in the network might give rise to the decoupling of the networks.
Sustainable ecological integrity requires the synergetic development of the economy and the environment. The phenomenon of booms and recession changes in a period is the economic cycle. A method based on individual strategies to research business cycles has been proven to be effective, and game theory modeling of a strategic behavioral approach is valid to analyze economic fluctuations [59]. Population and GDP indicators have an interaction strength of almost 1 of Spearman correlation coefficients (p < 0.01), which could explain the impacts of individual aspects of economic cycles on a microeconomic basis. Resonant factors that influence economic development are concentration of income, technology, and institutional frameworks [60]. A larger share of renewable energy in a country has been validated to be associated with lower inflation [61]. High energy prices usually enhance technological progress, technology spillovers, and thus boost economic growth in the next period [62]. Renewable energy, hydroelectric generation, and dam construction contribute to the development of economic activities in the Yangtze River Basin. The value of Spearman correlation coefficients of X3 (cumulative reservoir storage capacity upstream of TGR) and X7 (GDP of the Yangtze River Economic Belt) before and after the TGD were 0.995 and 1 with significant correlation coefficients, respectively. X6 (Sewage treatment rate) has a significant relationship interaction strength with X7 and could validate the technology and thus boost economic growth.
Although important and interesting findings were provided by this study, there are still some limitations to the dataset and methodology. First, due to data limitations, there were no macrobenthos indicators in this study, and there were some missing values for X1, X20, X21, and X23 from 1949 to 2018. As more data become available in the future, the approach could be easily applied to offer a more comprehensive picture of Yangtze River interactions. Second, the interactions among the indicators were analyzed using Spearman correlation coefficients as proxies that could not indicate causality [63]. As the data became more abundant and the method developed, the analysis of interactions could be changed from correlation to causality, such as Granger causality analysis, and the networks could be changed to directed [64,65]. Future studies could further research the complex mechanisms behind the synergy and trade-off among the indicators and find a solution to balance the conflict [66]. This study could be applied to investigate changes in the overall networks of environmental ecosystems [22].

5. Conclusions

In conclusion, this study constructed sustainable ecological integrity networks and revealed the changes in interactions among 38 social–ecological indicators before and after the TGD operation. The identification of the alteration of decoupling and recoupling of these proxies of the Yangtze River Basin after 2003 strengthens the understanding of the ecosystem status of the basin and might be useful to identify policies for basin management and to analyze changes at other scales. The more isolated clusters and less connected relationships between the indicators from the 2004 to 2018 period phenomenon imply that the sustainable development level of the Yangtze River Basin was at the middle level during this period. Network metrics such as connectivity, modularity, and NESH were selected to provide a complementary perspective on social economic conditions and ecosystem integrity connections. Moreover, node connectivity and NESH in network analysis can be applied as a new objective method for index selection in ecological integrity assessment.
This approach has proven useful (i) to demonstrate changes in cluster composition and key nodes related Yangtze River Basin, (ii) to show that the connectivity of networks decreased and more isolated modules were clustered after the trial operation of the TGD (in 2003), and (iii) to illustrate the regime shift time of driver nodes of network changes.
Ecosystem and socioeconomic condition responses to TDG were analyzed and showed that connectivity is relatively higher in reservoir storage capacity, cargo volume, sewage treatment, fishery resources, and sediment concentration. Meanwhile, the mean annual discharge, downstream Jianli fry runoff, and downstream Jianli eggs and larvae of the four carp species might be regarded as the driver indicators of synergy network changes, and the diatom abundance index, number of breeding populations of Chinese sturgeon, and annual precipitation might be the driving factors that contribute more to the trade-off network changes. These results could be helpful in indicating the mechanistic framework of the socioeconomic ecosystem of the Yangtze River Basin. Moreover, the results suggest that the correlation network method can be applied to ecological integrity assessment and is important for watershed management. In addition, node connectivity and NESH in network analysis could be applied as a new objective indicator selection method in ecological integrity assessment to compensate for the subjectivity of the indicator selection principle.

Supplementary Materials

The following supporting information can be downloaded at: https://www.mdpi.com/article/10.3390/su15054465/s1, Figure S1: 1949–2003 synergy networks; Figure S2: 2004–2018 synergy networks; Figure S3: 1949–2003 trade-off networks; Figure S4: 2004–2018 trade-off networks; Figure S5: Common synergy sub-network view with highlighted ‘driver’ nodes; Figure S6: Regime shift detection of driver indicators of synergy networks alteration; Figure S7: Common trade-off sub-network view with highlighted ‘driver’ nodes; Figure S8: Regime shift detection of driver indicators of trade-off networks alteration

Author Contributions

Conceptualization, X.L. and M.H.; Data curation, X.W. and M.S.; Formal analysis, X.L. and Y.B.; Investigation, X.L. and J.W.; Methodology, X.L., Y.W. and S.L.; Project administration, Y.W.; Resources, X.L., Y.W., M.H., Y.B. and X.W.; Software, X.L., J.W. and D.Z.; Supervision, Y.W.; Validation, X.L., Y.W. and S.L.; Writing—original draft, X.L.; Writing—review and editing, X.L. and Y.W. All authors have read and agreed to the published version of the manuscript.

Funding

This study was funded by grants from National Natural Science Foundation of China (92047204, 92047203, U2040211); the National Key Research and Development Program of China, grant number 2021YFC3201002; the National Science Foundation for Young Scientists of China, grant number 42107283; the Project of China Three Gorges Corporation, grant number 201903144, 202003173.

Institutional Review Board Statement

Not applicable.

Informed Consent Statement

Not applicable.

Data Availability Statement

Not applicable.

Acknowledgments

The authors would like to thank the Three Gorges Corporation for the material data provided.

Conflicts of Interest

The authors declare no conflict of interest.

References

  1. Gain, A.K.; Giupponi, C. A Dynamic Assessment of Water Scarcity Risk in the Lower Brahmaputra River Basin: An Integrated Approach. Ecol. Indic. 2015, 48, 120–131. [Google Scholar] [CrossRef]
  2. Yang, X.; Meng, F.; Fu, P.; Zhang, Y.; Liu, Y. Spatiotemporal Change and Driving Factors of the Eco-Environment Quality in the Yangtze River Basin from 2001 to 2019. Ecol. Indic. 2021, 131, 108214. [Google Scholar] [CrossRef]
  3. Penghao, C.; Pingkuo, L.; Hua, P. Prospects of Hydropower Industry in the Yangtze River Basin: China’s Green Energy Choice. Renew. Energy 2019, 131, 1168–1185. [Google Scholar] [CrossRef]
  4. Liu, J.; Diamond, J. China’s Environment in a Globalizing World. Nature 2005, 435, 1179–1186. [Google Scholar] [CrossRef] [PubMed]
  5. Liu, Y.; Zhu, J.; Li, E.Y.; Meng, Z.; Song, Y. Environmental Regulation, Green Technological Innovation, and Eco-Efficiency: The Case of Yangtze River Economic Belt in China. Technol. Forecast. Soc. Chang. 2020, 155, 119993. [Google Scholar] [CrossRef]
  6. Li, K.; Zhu, C.; Wu, L.; Huang, L. Problems Caused by the Three Gorges Dam Construction in the Yangtze River Basin: A Review. Environ. Rev. 2013, 21, 127–135. [Google Scholar] [CrossRef]
  7. Zhang, H.; Kang, M.; Shen, L.; Wu, J.; Li, J.; Du, H.; Wang, C.; Yang, H.; Zhou, Q.; Liu, Z.; et al. Rapid Change in Yangtze Fisheries and Its Implications for Global Freshwater Ecosystem Management. Fish Fish. 2020, 21, 601–620. [Google Scholar] [CrossRef]
  8. Fu, B.J.; Wu, B.F.; Lü, Y.H.; Xu, Z.H.; Cao, J.H.; Niu, D.; Yang, G.S.; Zhou, Y.M. Three Gorges Project: Efforts and Challenges for the Environment. Prog. Phys. Geogr. 2010, 34, 741–754. [Google Scholar] [CrossRef]
  9. Liu, X.; Qin, J.; Xu, Y.; Ouyang, S.; Wu, X. Biodiversity Decline of Fish Assemblages after the Impoundment of the Three Gorges Dam in the Yangtze River Basin, China. Rev. Fish. Biol. Fish. 2019, 29, 177–195. [Google Scholar] [CrossRef]
  10. Müller, B.; Berg, M.; Yao, Z.P.; Zhang, X.F.; Wang, D.; Pfluger, A. How Polluted Is the Yangtze River? Water Quality Downstream from the Three Gorges Dam. Sci. Total Environ. 2008, 402, 232–247. [Google Scholar] [CrossRef]
  11. Cheng, L.; Blanchet, S.; Loot, G.; Villéger, S.; Zhang, T.; Lek, S.; Lek-Ang, S.; Li, Z. Temporal Changes in the Taxonomic and Functional Diversity of Fish Communities in Shallow Chinese Lakes: The Effects of River-Lake Connections and Aquaculture. Aquat. Conserv. 2014, 24, 23–34. [Google Scholar] [CrossRef]
  12. Ma, T.; Zhou, W.; Chen, L.; Wu, L.; Peter, C.; Dai, G. Concerns about the Future of Chinese Fisheries Based on Illegal, Unreported and Unregulated Fishing on the Hanjiang River. Fish Res. 2018, 199, 212–217. [Google Scholar] [CrossRef]
  13. Zhang, X.; Dong, Z.; Gupta, H.; Wu, G.; Li, D. Impact of the Three Gorges Dam on the Hydrology and Ecology of the Yangtze River. Water 2016, 8, 590. [Google Scholar] [CrossRef] [Green Version]
  14. Dai, Z.; Chu, A.; Stive, M.; Du, J.; Li, J. Is the Three Gorges Dam the Cause behind the Extremely Low Suspended Sediment Discharge into the Yangtze (Changjiang) Estuary of 2006? Hydrol. Sci. J. 2011, 56, 585136. [Google Scholar] [CrossRef]
  15. Wang, J.; Sheng, Y.; Gleason, C.J.; Wada, Y. Downstream Yangtze River Levels Impacted by Three Gorges Dam. Environ. Res. Lett. 2013, 8, 044012. [Google Scholar] [CrossRef]
  16. Yi, Y.; Wang, Z.; Yang, Z. Impact of the Gezhouba and Three Gorges Dams on Habitat Suitability of Carps in the Yangtze River. J. Hydrol. 2010, 387, 283–291. [Google Scholar] [CrossRef]
  17. Kandziora, M.; Burkhard, B.; Müller, F. Interactions of Ecosystem Properties, Ecosystem Integrity and Ecosystem Service Indicators: A Theoretical Matrix Exercise. Ecol. Indic. 2013, 28, 54–78. [Google Scholar] [CrossRef]
  18. Palmer, M.A.; Febria, C.M. The Heartbeat of Ecosystems. Science 2012, 336, 1393–1394. [Google Scholar] [CrossRef]
  19. Maloney, E.M. How Do We Take the Pulse of an Aquatic Ecosystem? Current and Historical Approaches to Measuring Ecosystem Integrity. Environ. Toxicol. Chem. 2019, 38, 289–301. [Google Scholar] [CrossRef] [Green Version]
  20. Schiemer, F. Fish as Indicators for the Assessment of the Ecological Integrity of Large Rivers. Hydrobiology 2000, 422, 271–278. [Google Scholar] [CrossRef]
  21. Dee, L.E.; Allesina, S.; Bonn, A.; Eklöf, A.; Gaines, S.D.; Hines, J.; Jacob, U.; McDonald-Madden, E.; Possingham, H.; Schröter, M.; et al. Operationalizing Network Theory for Ecosystem Service Assessments. Trends Ecol. Evol. 2017, 32, 118–130. [Google Scholar] [CrossRef] [PubMed] [Green Version]
  22. Felipe-Lucia, M.R.; Soliveres, S.; Penone, C.; Fischer, M.; Ammer, C.; Boch, S.; Boeddinghaus, R.S.; Bonkowski, M.; Buscot, F.; Fiore-Donno, A.M.; et al. Land-Use Intensity Alters Networks between Biodiversity, Ecosystem Functions, and Services. Proc. Natl. Acad. Sci. USA 2020, 117, 28140–28149. [Google Scholar] [CrossRef] [PubMed]
  23. Bali Swain, R.; Ranganathan, S. Modeling Interlinkages between Sustainable Development Goals Using Network Analysis. World Dev. 2021, 138, 105136. [Google Scholar] [CrossRef]
  24. Liu, J.; Tian, Y.; Huang, K.; Yi, T. Spatial-Temporal Differentiation of the Coupling Coordinated Development of Regional Energy-Economy-Ecology System: A Case Study of the Yangtze River Economic Belt. Ecol. Indic. 2021, 124, 107394. [Google Scholar] [CrossRef]
  25. Wu, X.; Fu, B.; Wang, S.; Song, S.; Li, Y.; Xu, Z.; Wei, Y.; Liu, J. Decoupling of SDGs Followed by Re-Coupling as Sustainable Development Progresses. Nat. Sustain. 2022, 5, 452–459. [Google Scholar] [CrossRef]
  26. Barabási, A.L.; Gulbahce, N.; Loscalzo, J. Network Medicine: A Network-Based Approach to Human Disease. Nat. Rev. Genet. 2011, 12, 56–68. [Google Scholar] [CrossRef] [PubMed] [Green Version]
  27. Bodin, Ö.; Alexander, S.M.; Baggio, J.; Barnes, M.L.; Berardo, R.; Cumming, G.S.; Dee, L.E.; Fischer, A.P.; Fischer, M.; Mancilla Garcia, M.; et al. Improving Network Approaches to the Study of Complex Social–Ecological Interdependencies. Nat. Sustain. 2019, 2, 551–559. [Google Scholar] [CrossRef] [Green Version]
  28. Zhou, X.Y.; Lei, K. Influence of Human-Water Interactions on the Water Resources and Environment in the Yangtze River Basin from the Perspective of Multiplex Networks. J. Clean. Prod. 2020, 265, 121783. [Google Scholar] [CrossRef]
  29. Jungwirth, M.; Muhar, S.; Schmutz, S. Re-Establishing and Assessing Ecological Integrity in Riverine Landscapes. Freshw. Biol. 2002, 47, 867–887. [Google Scholar] [CrossRef]
  30. Cairns, J. Ecological Integrity of Aquatic Systems. Regul. Rivers Res. Manag. 1995, 11, 313–323. [Google Scholar] [CrossRef]
  31. Ward, J.V. International Conference: Sustaining the Ecological Integrity of Large Floodplain Rivers. Regul. Rivers Res. Manag. 1995, 11, 1–2. [Google Scholar] [CrossRef]
  32. Chen, Y.; Qu, X.; Xiong, F.; Lu, Y.; Wang, L.; Hughes, R.M. Challenges to Saving China’s Freshwater Biodiversity: Fishery Exploitation and Landscape Pressures. Ambio 2020, 49, 926–938. [Google Scholar] [CrossRef] [PubMed]
  33. Cheng, L.; Opperman, J.J.; Tickner, D.; Speed, R.; Guo, Q.; Chen, D. Managing the Three Gorges Dam to Implement Environmental Flows in the Yangtze River. Front. Environ. Sci. 2018, 6, 64. [Google Scholar] [CrossRef] [Green Version]
  34. Wang, H.; Wang, P.; Xu, C.; Sun, Y.; Shi, L.; Zhou, L.; Jeppesen, E.; Chen, J.; Xie, P. Can the “10-Year Fishing Ban” Rescue Biodiversity of the Yangtze River? Innovation 2022, 3, 100235. [Google Scholar] [CrossRef] [PubMed]
  35. Gogtay, N.J.; Thatte, U.M. Principles of Correlation Analysis. J. Assoc. Physicians India 2017, 65, 78–81. [Google Scholar]
  36. Lade, S.J.; Steffen, W.; de Vries, W.; Carpenter, S.R.; Donges, J.F.; Gerten, D.; Hoff, H.; Newbold, T.; Richardson, K.; Rockström, J. Human Impacts on Planetary Boundaries Amplified by Earth System Interactions. Nat. Sustain. 2020, 3, 119–128. [Google Scholar] [CrossRef]
  37. Csardi, G.; Nepusz, T. The Igraph Software Package for Complex Network Research. InterJ. Complex Syst. 2006, 1695, 1–9. [Google Scholar]
  38. Gábor, C.; Tamás, N.; Edoardo, M.A. Statistical Network Analysis with Igraph (R); Springer: Berlin/Heidelberg, Germany, 2016. [Google Scholar]
  39. Pons, P.; Latapy, M. Computing Communities in Large Networks Using Random Walks. J. Graph Algorithms Appl. 2006, 10, 191–218. [Google Scholar] [CrossRef] [Green Version]
  40. Sebestyén, V.; Bulla, M.; Rédey, Á.; Abonyi, J. Network Model-Based Analysis of the Goals, Targets and Indicators of Sustainable Development for Strategic Environmental Assessment. J. Environ. Manag. 2019, 238, 126–135. [Google Scholar] [CrossRef]
  41. Laird, A.R.; Fox, P.M.; Eickhoff, S.B.; Turner, J.A.; Ray, K.L.; Mckay, D.R.; Glahn, D.C.; Beckmann, C.F.; Smith, S.M.; Fox, P.T. Behavioral Interpretations of Intrinsic Connectivity Networks. J. Cogn. Neurosci. 2011, 23, 4022–4037. [Google Scholar] [CrossRef] [Green Version]
  42. Kuntal, B.K.; Chandrakar, P.; Sadhu, S.; Mande, S.S. ‘NetShift’: A Methodology for Understanding ‘Driver Microbes’ from Healthy and Disease Microbiome Datasets. ISME J. 2019, 13, 442–454. [Google Scholar] [CrossRef] [Green Version]
  43. Yang, Z.; Algesheimer, R.; Tessone, C.J. A Comparative Analysis of Community Detection Algorithms on Artificial Networks. Sci. Rep. 2016, 6, 30750. [Google Scholar] [CrossRef] [PubMed] [Green Version]
  44. Clauset, A.; Newman, M.E.J.; Moore, C. Finding Community Structure in Very Large Networks. Phys. Rev. E Stat. Phys. Plasmas Fluids Relat. Interdiscip. Top. 2004, 70, 066111. [Google Scholar] [CrossRef] [PubMed] [Green Version]
  45. Rodionov, S.; Overland, J.E. Application of a Sequential Regime Shift Detection Method to the Bering Sea Ecosystem. ICES J. Mar. Sci. 2005, 62, 328–332. [Google Scholar] [CrossRef]
  46. Rodionov, S.N. Use of Prewhitening in Climate Regime Shift Detection. Geophys. Res. Lett. 2006, 33, L12707. [Google Scholar] [CrossRef] [Green Version]
  47. Dinda, S. Environmental Kuznets Curve Hypothesis: A Survey. Ecol. Econ. 2004, 49, 431–455. [Google Scholar] [CrossRef] [Green Version]
  48. Wang, A.; Tang, L.H.; Yang, D.W.; Lei, H.M. Spatio-Temporal Variation of Net Anthropogenic Nitrogen Inputs in the Upper Yangtze River Basin from 1990 to 2012. Sci. China Earth Sci. 2016, 59, 2189–2201. [Google Scholar] [CrossRef]
  49. Olesen, J.M.; Bascompte, J.; Dupont, Y.L.; Jordano, P. The Modularity of Pollination Networks. Proc. Natl. Acad. Sci. USA 2007, 104, 19891–19896. [Google Scholar] [CrossRef] [Green Version]
  50. Jiang, H.; Simonovic, S.P.; Yu, Z.; Wang, W. What Are the Main Challenges Facing the Sustainable Development of China’s Yangtze Economic Belt in the Future? An Integrated View. Environ. Res. Commun. 2021, 3, 115005. [Google Scholar] [CrossRef]
  51. Yang, H.F.; Yang, S.L.; Xu, K.H.; Milliman, J.D.; Wang, H.; Yang, Z.; Chen, Z.; Zhang, C.Y. Human Impacts on Sediment in the Yangtze River: A Review and New Perspectives. Glob. Planet. Chang. 2018, 162, 8–17. [Google Scholar] [CrossRef]
  52. Huang, Z.; Wang, L. Yangtze Dams Increasingly Threaten the Survival of the Chinese Sturgeon. Curr. Biol. 2018, 28, 3640–3647. [Google Scholar] [CrossRef] [PubMed]
  53. Chen, D.; Xiong, F.; Wang, K.; Chang, Y. Status of Research on Yangtze Fish Biology and Fisheries. Environ. Biol. Fishes 2009, 85, 337–357. [Google Scholar] [CrossRef]
  54. Gao, X.; Lin, P.; Li, M.; Duan, Z.; Liu, H. Impact of the Three Gorges Dam on the Spawning Stock and Natural Reproduction of Chinese Sturgeon in Changjiang River, China. Chin. J. Oceanol. Limnol. 2016, 34, 894–901. [Google Scholar] [CrossRef]
  55. Wu, L.; Zhang, Q.; Jiang, Z. Three Gorges Dam Affects Regional Precipitation. Geophys. Res. Lett. 2006, 33, L13806. [Google Scholar] [CrossRef] [Green Version]
  56. Lusseau, D.; Mancini, F. Income-Based Variation in Sustainable Development Goal Interaction Networks. Nat. Sustain. 2019, 2, 242–247. [Google Scholar] [CrossRef] [Green Version]
  57. Duncan, C.; Thompson, J.R.; Pettorelli, N. The Quest for a Mechanistic Understanding of Biodiversity–Ecosystem Services Relationships. Proc. R. Soc. B Biol. Sci. 2015, 282, 20151348. [Google Scholar] [CrossRef] [Green Version]
  58. Albrecht, J.; Gertrud Berens, D.; Jaroszewicz, B.; Selva, N.; Brandl, R.; Farwig, N. Correlated Loss of Ecosystem Services in Coupled Mutualistic Networks. Nat. Commun. 2014, 5, 3810. [Google Scholar] [CrossRef] [Green Version]
  59. Čermáková, K.; Bejček, M.; Vorlíček, J.; Mitwallyová, H. Neglected Theories of Business Cycle—Alternative Ways of Explaining Economic Fluctuations. Data 2021, 6, 109. [Google Scholar] [CrossRef]
  60. Ríos, M.Á.R.; López, J.B.L.; Veiga, J.G. Present and Future in the Mirror of the Past: Capitalist Dynamics, Digital Technology and Industry in the Fifth Kondratiev. World Rev. Political Econ. 2019, 10, 449–483. [Google Scholar] [CrossRef]
  61. Bednář, O.; Čečrdlová, A.; Kadeřábková, B.; Řežábek, P. Energy Prices Impact on Inflationary Spiral. Energies 2022, 15, 3443. [Google Scholar] [CrossRef]
  62. Pala, A. Investigating the relation between technology and economic growth with AK model: An application swamy’s random coefficient model (RCM). Int. J. Econ. Sci. 2018, 7, 107–118. [Google Scholar] [CrossRef]
  63. le Blanc, D. Towards Integration at Last? The Sustainable Development Goals as a Network of Targets. Sustain. Dev. 2015, 23, 176–187. [Google Scholar] [CrossRef]
  64. Ospina-Forero, L.; Castañeda, G.; Guerrero, O.A. Estimating Networks of Sustainable Development Goals. Inf. Manag. 2020, 59, 103342. [Google Scholar] [CrossRef]
  65. Dörgo, G.; Sebestyén, V.; Abonyi, J. Evaluating the Interconnectedness of the Sustainable Development Goals Based on the Causality Analysis of Sustainability Indicators. Sustainability 2018, 10, 3766. [Google Scholar] [CrossRef] [Green Version]
  66. Nilsson, M.; Chisholm, E.; Griggs, D.; Howden-Chapman, P.; McCollum, D.; Messerli, P.; Neumann, B.; Stevance, A.S.; Visbeck, M.; Stafford-Smith, M. Mapping Interactions between the Sustainable Development Goals: Lessons Learned and Ways Forward. Sustain. Sci. 2018, 13, 1489–1503. [Google Scholar] [CrossRef] [Green Version]
Figure 1. Yangtze River Basin map in WGS 1984 coordinate system.
Sustainability 15 04465 g001
Figure 2. Synergy networks connectivity. X-axis represents the 38 indicators. Y-axis is the connectivity value of the corresponding nodes.
Sustainability 15 04465 g002
Figure 3. Trade-off networks connectivity. X-axis represents the 38 indicators. Y-axis is the connectivity value of the corresponding nodes.
Sustainability 15 04465 g003
Figure 4. Module composition of synergy and trade-off networks and their changes at different period groups. (a) Changes in module composition of the synergy and trade-off networks at different period groups, in which A represents after TGD period, which is 2004–2018 period, and B represents before TGD period, which is 1949–2003 period. (b) Modules of the synergy and trade-off networks at different period groups. Different background colors represent different modules. Different node colors represent different modules and different module colors are randomly assigned. Gray lines represent indicator interactions in the same module and different modules. Indicators that did not have relationships with other nodes are not shown in this (b).
Sustainability 15 04465 g004
Table 1. Indicators related to sustainable ecosystem integrity systems in the Yangtze River Basin.
Indicator TypeIndicator Code
Sustainable ecological integrityEcological integrityBiological integrity
(ecological processes and functions)
Fishery resourcesY1
Y2
Y3
Y4
Y5
Y6
Y7
Y8
Y9
Y10
Y11
DiatomY12
Y13
Y14
Physical integrity
(habitat quality)
Water and sediment effectX17
X18
X19
Landscape mosaic structureX11
X12
X13
Watershed connectivityX24
TemperatureX20
Chemical integrity
(biogeochemical cycle)
NutrimentX15
X16
X21
X23
Water qualityX22
Economic and social conditionDam conditionsX3
Pollution statusX4
X5
X6
Agricultural fertilization statusX9
X10
X14
Economic conditionsX2
X7
X8
X1
Table 2. Thirty-eight indicators of social economic and ecosystem integrity data information. Start year and End year mean the time horizon of time-series data.
IndicatorsIndicator CodeUnitsStart YearEnd YearMinimum ValueMaximum ValueData NumberData Sources
Annual catch of fishY110,000 tons1949201854370China Three Gorges Corporation and [7]
Number of Breeding population of Chinese sturgeonY2tail1972201818230940China Three Gorges Corporation
Hilsa fishing yieldY3ton196119860158213China Three Gorges Corporation
Sand mined in mainstream of middle and lower Yangtze RiverX110,000 tons2004201629,467107,55213[32]
Total cargo volume in the Yangtze River BasinX210,000 tons199820174844420[32]
Total estimated number of adult Chinese paddlefish below the Gezhouba Dam in the mainstream of the Yangtze RiverY4tail1981201003224[32]
Total number of the four major carp species fry (hundred million) below Gezhouba Dam in the mainstream Yangtze RiverY5100 million1997201616721[32]
Total catch of bronze gudgeon below Gezhouba Dam in the mainstream Yangtze RiverY6ton2000201574271615[32]
Total catch of Yellow catfish below Gezhouba Dam in the mainstream Yangtze RiverY7ton200120153524815[32]
Cumulative reservoir storage capacity upstream of TGDX3km319562017113062China Three Gorges Corporation
Industrial wastewater in the Yangtze River Economic BeltX410,000 tons19852010938,0711,424,12726China Three Gorges Corporation
Domestic sewage in the Yangtze River Economic BeltX510,000 tons1985201001,584,57026China Three Gorges Corporation
Sewage treatment rateX6%19912017159527China Three Gorges Corporation
GDP of Yangtze River Economic BeltX7100 million Yuan1949201858402,98570China Three Gorges Corporation
Population of Yangtze River Economic Belt at year endX810,0001949201818,77859,87370China Three Gorges Corporation
Nitrogen application amountX910,000 tons1979201836199440China Three Gorges Corporation
Application amount of compound fertilizerX1010,000 tons19802018869739China Three Gorges Corporation
Total planting area in the Yangtze River Economic BeltX111000 Ha1978201860,91567,62241China Three Gorges Corporation
Forest area of Yangtze River Economic BeltX1210,000 Ha198020183998904839China Three Gorges Corporation
Grassland area in the Yangtze River Economic BeltX131000 Ha1980201753,81464,62138China Three Gorges Corporation
Application amount of phosphate fertilizer in the Yangtze River Economic BeltX1410,000 tons1979201811232240China Three Gorges Corporation
LTNX15kg/(km2·yr)19802015969194236China Three Gorges Corporation
LTPX16kg/(km2·yr)198020157116636China Three Gorges Corporation
Average number of upstream fish speciesY8 19972015427617China Three Gorges Corporation
Percentage of upstream endemic fish speciesY9%199720150.120.5717China Three Gorges Corporation
Downstream (Jianli) Four Carp Eggs and larvae (billion)Y10billion199720160420[33]
Downstream (Jianli) fry runoff 100 million fishY11100 million fish1964201607225China Three Gorges Corporation
Mean annual dischargeX17m3/s1959201810,57718,34360China Three Gorges Corporation
Annual precipitationX18mm19512018805153068China Three Gorges Corporation
Sediment concentrationX19kg/m3196020180.050.7459China Three Gorges Corporation
Absolute diatom abundanceY12PCS/g dry weight19622012106015,72911China Three Gorges Corporation
Diatom aroma—Wiener countY13 196220122511China Three Gorges Corporation
Diatom abundance indexY14 196220122411China Three Gorges Corporation
Water temperatureX20Degrees Celsius19581985172128China Three Gorges Corporation
Total ionX21mg/L1958198518622628China Three Gorges Corporation
Oxygen consumption (Dissolved oxygen)X22mg/L195819851441China Three Gorges Corporation
Ion flow rateX23g/s196019843,023,8414,998,83425China Three Gorges Corporation
Cumulated area of isolated lakeX24km219492019357819570[34]
Disclaimer/Publisher’s Note: The statements, opinions and data contained in all publications are solely those of the individual author(s) and contributor(s) and not of MDPI and/or the editor(s). MDPI and/or the editor(s) disclaim responsibility for any injury to people or property resulting from any ideas, methods, instructions or products referred to in the content.

